Dashboard
The Dashboard gives you an at-a-glance view of a group’s or a session’s activity on a given test: number of completed tests, average completion time, breakdown by status and score level, top candidates and the state of your credit packs. It is the ideal page to monitor a testing campaign before drilling into details on the Results page.
Access this page via the Results → Dashboard menu.
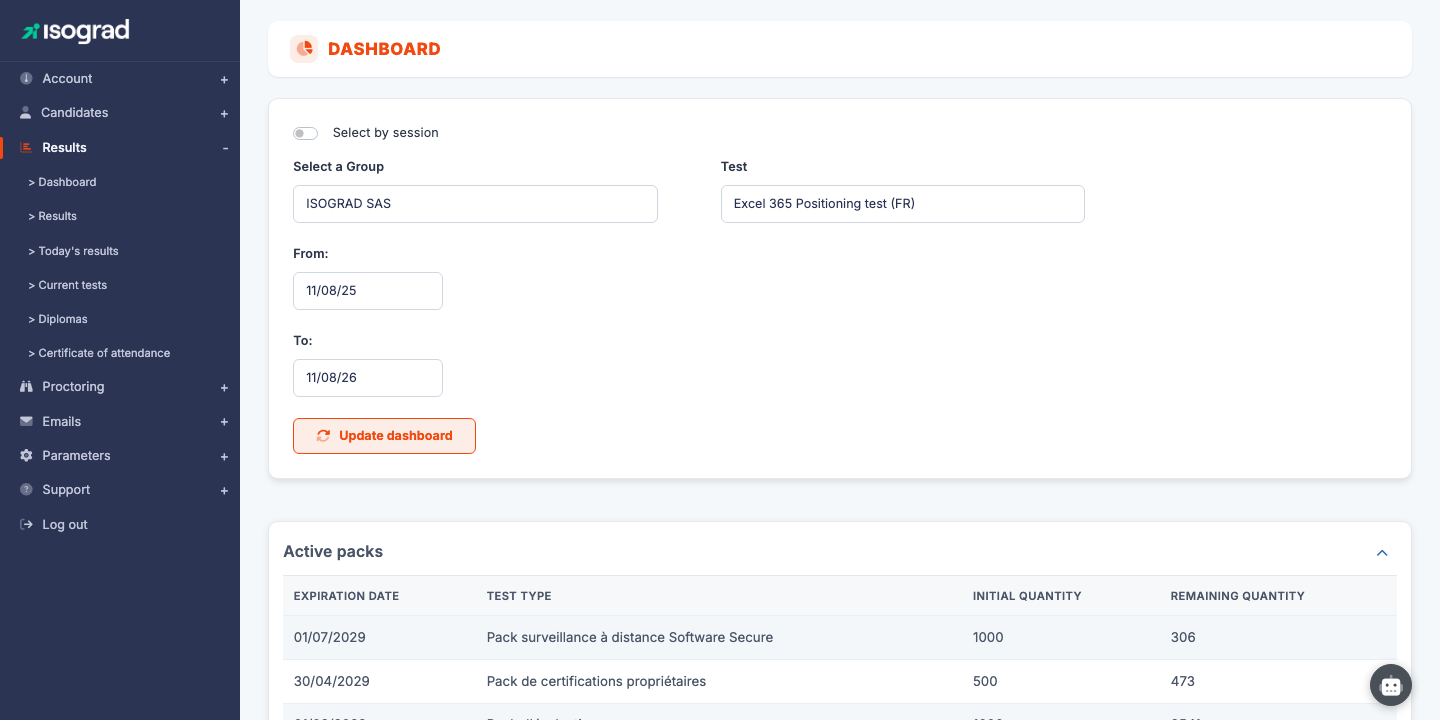
💡 Only completed tests feed the metrics. If the selected group, session or period contains no completed test, the page shows a message inviting you to adjust the filters.
Dashboard filters
The panel at the top of the page determines what the dashboard aggregates:
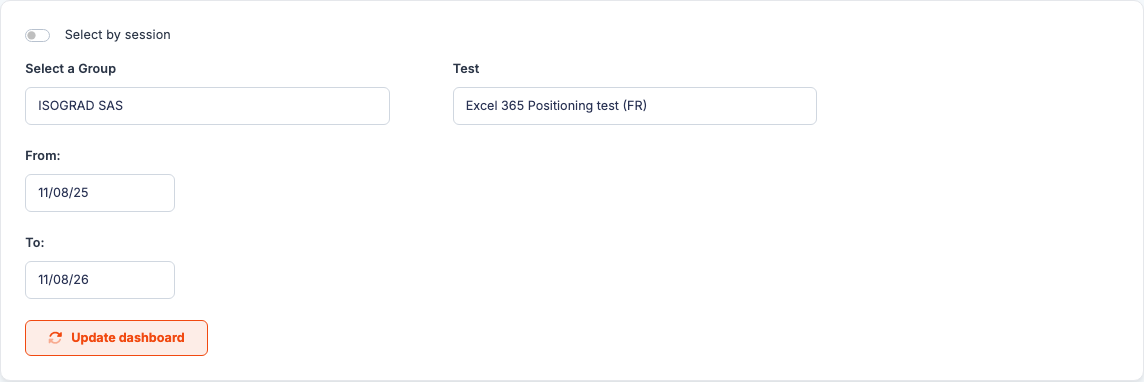
- Select by session (switch) — toggles between group-based and session-based selection (see Select by session).
- Select a group — the candidate group to analyse. If the group has sub-groups, a sub-group selector appears to narrow the selection.
- Test — the test to analyse. The list refreshes automatically whenever you change the group, sub-group or session: it only offers tests actually taken by the selected population.
- Period from / to — the date interval taken into account (default: the last twelve months). A completed test is included if its completion date falls within the period; a non-completed test (pending, started) is included if its registration date falls within the period.
Click Update the dashboard to apply the filters and reload the metrics.
💡 Your filters are remembered: when you come back to the page, your last selection is restored.
Select by session
If your account uses test sessions, enable the Select by session switch: the group selector is replaced by a session selector, and the test list reloads with the tests taken in the chosen session.
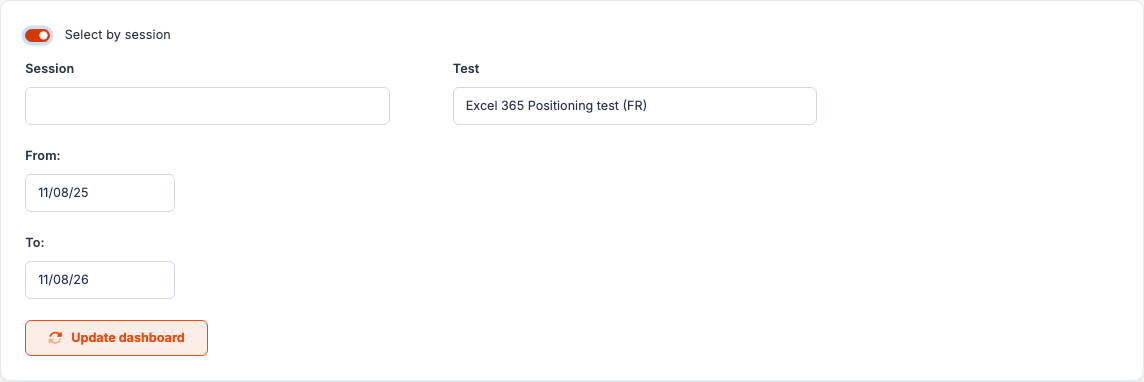
This mode is handy to review one specific exam session (one date, one room) rather than a whole group.
Metrics and charts
Once the filters are applied, the dashboard displays:

- Completed tests — the number of completed attempts in the selection.
- Average time — the average duration of an attempt. This card is only filled in when the completion time is measurable for the selected test (timed tests or tests without free navigation).
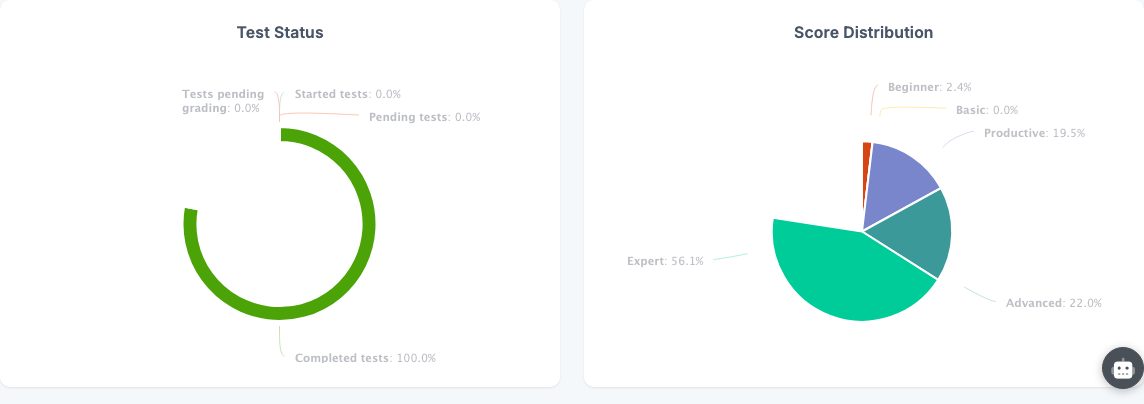
- Test status — the breakdown of the tests in the selection registered or completed within the period between pending, started, completed and waiting for marking.
- Score distribution — the distribution of completed tests by score level (for example Initial, Basic, Operational, Advanced, Expert for Tosa assessments).
Depending on the test and your account options, additional blocks may appear: an invitation tracking chart (emails sent, reminders, candidates never invited) and a success rate per question table.
Top 10 candidates
The Top 10 table ranks the ten best candidates of the selection — for each candidate, only their best score is kept:
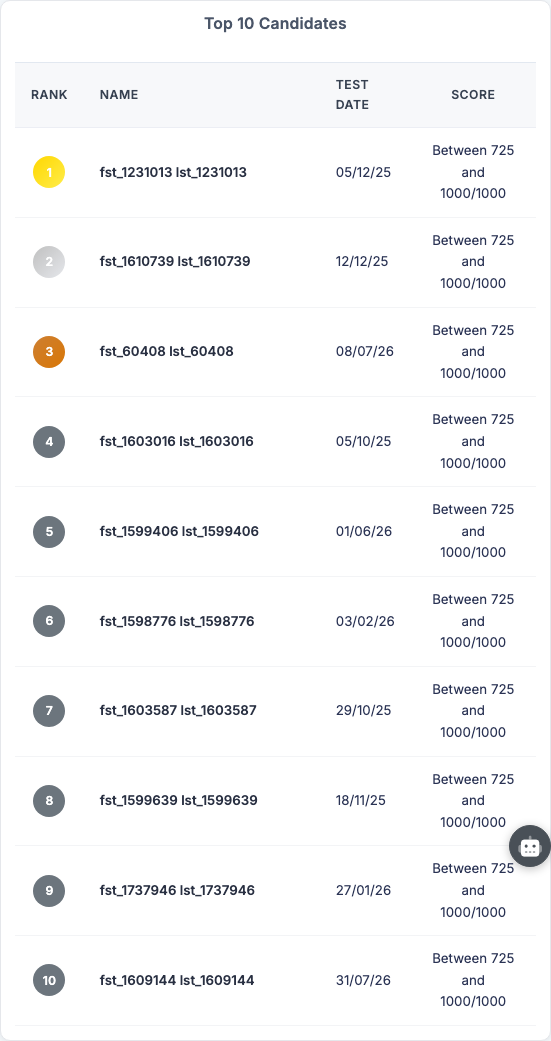
| Column | Content |
|---|---|
| Rank | Position in the ranking (the first three are highlighted). |
| Name | Candidate identity. |
| Test date | Date of the attempt matching the best score. |
| Score | The best score achieved on the selected test. |
Active packs
At the top of the dashboard, the Active packs block summarises the state of your credits — the same detail as in Account management:
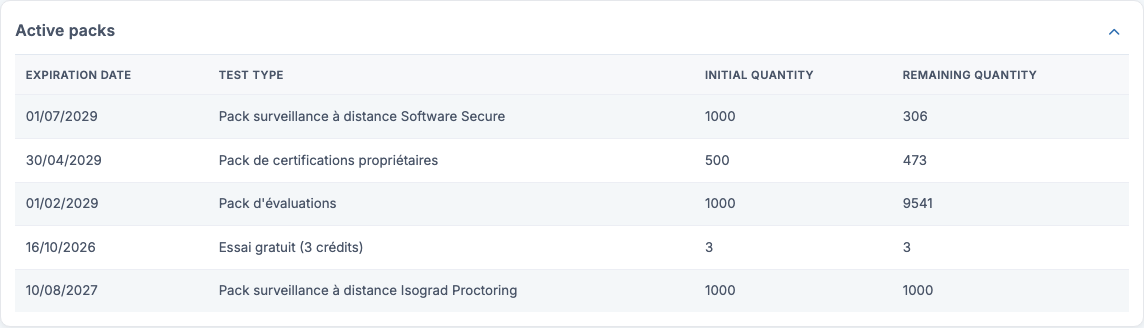
For each pack: the expiration date, the test type, the initial quantity and the remaining quantity. Only active, non-expired packs are listed; the full history remains available in the Packs tab of your account. The block can be collapsed with the arrow at the top right.